


New Findings Emerge from In-Store Analytics
According to Gartner’s 2013 BI (Business Intelligence) Magic Quadrant, spending for retail analytics is on the rise. The firm estimates that as BI and analytics rise on retailer’s own shopping lists, such efforts will reach $17.1 billion by 2016.
This is particularly important if businesses are to make the most of brick and mortar stores. According to a report from analyst firm Retail Systems Research, 55 percent of retailers have pointed to physical stores as the outlet that can most benefit from real-time BI.
This value is driven because of retailers are now able to measure in-store shopper traffic to learn more about movement patterns through the store. In addition, metrics such as peak traffic by zone or department, shopping patterns, repeat traffic and the amount of time shoppers spend looking at particular items are all helping to optimize store layouts and effectively market to a retailer’s target audience.
Already, Jim Riesenbach, CEO of iInside has reported three key trends found real-time in-store analytics: shopper non-buyer statistics, in-store marketing effectiveness and trip behavior.
What Riesenbach defines as “shopper non-buyers” refers to the group of customers who enter a store, browse, but never make a purchase, which naturally represents a tempting demographic when a retailer looks for to add to its buyers. One retailer, Riesenbach reports, found that although 54 of its customers went to a particular area of the store the week before Black Friday and Cyber Monday sales, only 16 percent of customer visits during these days resulted in purchases, which allowed it to more easily identify ways to appeal to the shopper non-buyer group.
In another example, a retailer found that by measuring where customers tended to go within a store layout, they could concentrate promotional signage and profitable products within the 30 percent of the store that gathered the majority of customer traffic for more effective marketing.
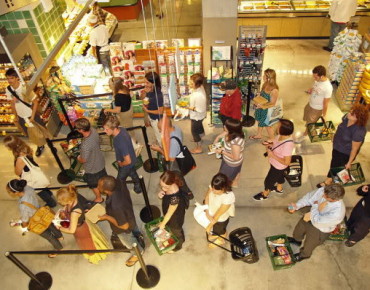
Finally, trip behavior, or the movement patterns and time spent within a store was the final area that Riesenbach identified as benefiting from in-store BI. In the example of grocery stores, he says that one grocer found that 15 percent of customers hopped lanes while in checkout lines. Another 20 percent used the store as a one-stop-shop, grabbing only a couple of items from the store before immediately heading to the checkout, much like one would expect in a convenient store. As a result, the grocer learned that rather than focusing on the arrangement of the aisles themselves, streamlining the checkout process was more likely to boost customer satisfaction.


