


Space-Time Insight Releases Update to Visual Analytics Software Suite
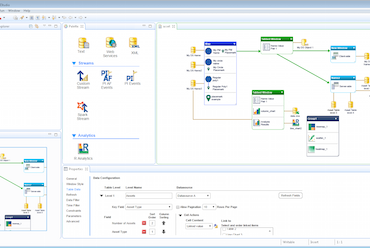
SI Suite 6.0 (Source: Space-Time Insight)
In its latest iteration of its real-time visual analytics software suite, Space-Time Insight focused on simplifying the process for developers and enhancing the application's real-time Spark Streaming capabilities.
SI Suite 6.0, announced today and slated to go into production during the first quarter of 2016, is designed to bridge the potentially expanding number of data silos organizations have in an Internet of Things world, said Steve Ehrlich, senior vice president of marketing and product marketing at Space-Time Insight, in an interview.
The software takes data from multiple sources such as traditional databases like Oracle or SAP; operational systems including IoT, sensors, and wearables, plus external sources such as social media, weather, and fire reports, he said.
"We correlate all that data, analyze it using advanced analytics, then we visualize it for the user using maps, charts, and so on, allowing them to get a big picture," Ehrlich said. "Most organizations today don't have that. The data lives in silos. They're having to correlate the data manually from one silo to another."
About 18 months after its last version came out, Space-Time's newest release includes three key new features, according to the San Mateo, Calif.-based developer.
SI Suite 6.0 uses Spark Streaming to process large volumes of sub-second streaming data, which the software then analyzes and visualizes on maps, charts, and additional formats, plus alerts. This allows organizations to quickly respond to time-sensitive events – such as product failures – and get value from terabytes of data, said Ehrlich.
The new version also allows users to see data in multiple visual formats within minutes, choosing from forms such as graphs or pie charts to best depict a particular problem or solution, he said. By simplifying how developers, data scientists, business analysts, and business users collaborate to solve problems, organizations can more quickly and thoroughly resolve issues and find opportunities, Ehrlich said.
Finally, version 6.0 integrates advanced analytics models with various data presentation formats such as maps, diagrams, and charts to help enterprises cut costs, pare down risk, and enhance customer satisfaction, according to Space-Time Insights.
One California utility company runs SI Suite on a video wall in its operations center to help operate its electricity grid, said Ehrlich. Operators use the real-time visuals to monitor whether, for example, fires threaten some lines or the utility is using all the renewable power available to it, he said. For its part, a Canadian utility tracks its assets with the software, avoiding outages and disruptions by replacing aging infrastructure before it fails, Ehrlich said.
"Situational intelligence is still in its infancy," he said. "It's really going way beyond the business intelligence market."


