


Four Major Myths Slow Business Analytics Adoption
 Business analytics can help small to medium sized manufacturers (SMMs) be more productive, but only after they overcome their reluctance to implement the technology because of some commonly held myths:
- They believe that they do not have sufficient data to run any analytics
- They believe that analytics cannot really reveal things they didn't already know
- They believe that analytics will not be able to predict certain scenarios which would have enabled them to be better prepared in the first place
All three reasons may have had some validity in the past, but increasingly these are beginning to sound like excuses for shying away from facing the complex realities of today's business and ignoring the value that other similar businesses are seeing. But there is also a fourth reason or myth, which fortunately is easy to dispel
4. They believe that implementing analytics in a small business like theirs is not affordable
In a typical manufacturing small business, generally the owner or chief executive takes on the responsibility of managing costs because he has more "skin in the game" than any of his workers. But a CEO's most precious resource is time. Data however comes in faster than there is time in the course of a day. Moreover, data by itself is ugly to look at; it needs to be properly digested before s/he can take meaningful actions or decisions based on data. This is where the value of an analytics dashboard to a manager or CEO would be very high. How would a dashboard make life easier and more efficient? Let us review what a typical dashboard can do:
1. It helps to consolidate the most critical information in one place.
2. A good dashboard can quickly reveal the health of a business through well thought out charts.
3. By providing interactivity, a dashboard can allow managers to run "what-if" scenarios which would once again help in decision making. For example, it can enable managers to make educated guesses on complex scenarios: "What happens to my overhead costs if I hire this new manager?" "Is overtime hurting or helping my overhead costs?"
Let us examine a real case of a small manufacturing business which has dispelled these myths and is on its way to successfully reaping value from analytics.
Problem: Manufacturing overhead is a significant cost. Controlling it requires real time monitoring
This SMB engineers and manufactures custom equipment which can be a significant portion of their total costs. They need to understand what factors influence overhead, and need to identify events which can add to overhead – such as the hiring of new personnel or changing overtime policies, for example. Clearly a real time overhead monitoring tool would be of great value. The solution for this situation is basically to build an overhead allocation model, pull data from their accounting system, and post the information to a dashboard, similar to the concept shown below.
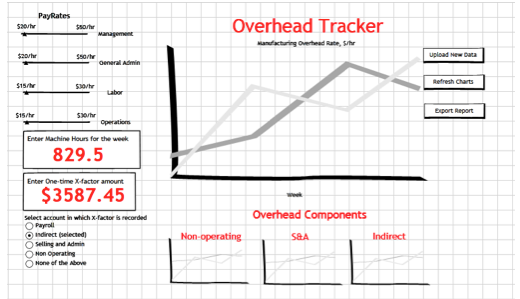
With that background, here is a simple process that would help you to set up a basic dashboard to manage your manufacturing overhead costs.
Define a basis for measuring manufacturing overhead rate
This is obviously a crucial step. There are many commonly accepted ways of measuring manufacturing overhead costs. Most of them involve dividing the total overhead costs by what is known as a cost driver. The cost driver is usually direct labor hours or direct machine hours.
MOH rate = Total Overhead / Cost Drivers
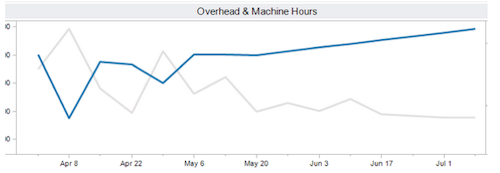
The cost drivers are usually measured in terms of labor hours or machining hours. For example, another customer has several machines and they record the total hours each machine is operated over the course of a week. This quantity is recorded in the new data that feeds the dashboard each accounting period and can be tracked over time as shown below.
Extract the right information for the various categories of manufacturing overhead
The next step is to determine what goes into the numerator. Typically manufacturing overhead consists of all indirect production costs such as indirect labor, rent, utilities and insurance; selling and general administrative costs, such as marketing, HR, IT etc; and non-operating expenses such as interest payments and similar quantities. The basic rule is to exclude all direct costs such as material, inventory and direct labor to make up the total manufacturing overhead costs. The dashboard should be designed to extract these quantities from an existing ERP or accounting database. The screen shot below captures these key metrics.
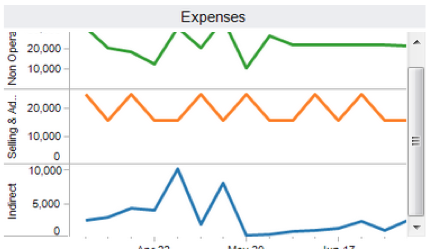
In addition, there may be special one-time expenses which may also need to be manually entered into the data that feeds the dashboard.
Refresh the dashboard on a regular basis to keep on top of things
This last step is of course crucial to efficiently manage costs. Every accounting period – typically a week or a month – the dashboard needs to be fed the latest data. The dashboard can be designed to directly access the required information by integrating with existing databases. For really small operations, it may be easier to simply query the accounting system to extract the relevant overhead costs and dump it into a spreadsheet. This spreadsheet can be quickly read into a dashboard of the type shown below which will immediately refresh the manufacturing overhead data.
Here is the overview of dashboard that is designed to track manufacturing overhead costs. The red line on the top chart can reveal valuable insight to the trained eye of the person overseeing the business. If there is a sudden spike in the overhead costs, s/he can drill down in the expenses which influence it and get a solid understanding of what special circumstances led to the increased costs.
If a picture is worth a thousand words, then a well-designed dashboard is worth a thousand gigabytes of data!

-----
About the Author
Dr. Bala Deshpande is the President and Founder of SimaFore. He has 20 years experience in data analytics and predictive modeling applied to product development, manufacturing and strategic planning. He holds a PhD in Bioengineering from Carnegie Mellon and an MBA from Ross School of Business (Michigan). SimaFore develops custom analytics solutions for small and midsized companies and specializes in predictive analytics.


