


Facebook Open Sources Datacenter Efficiency Tracking Tools
Companies that operate hyperscale datacenters have gone to great lengths to boost efficiency, and to show their commitment to green computing some of these cloud giants are sharing their designs with others in the community.
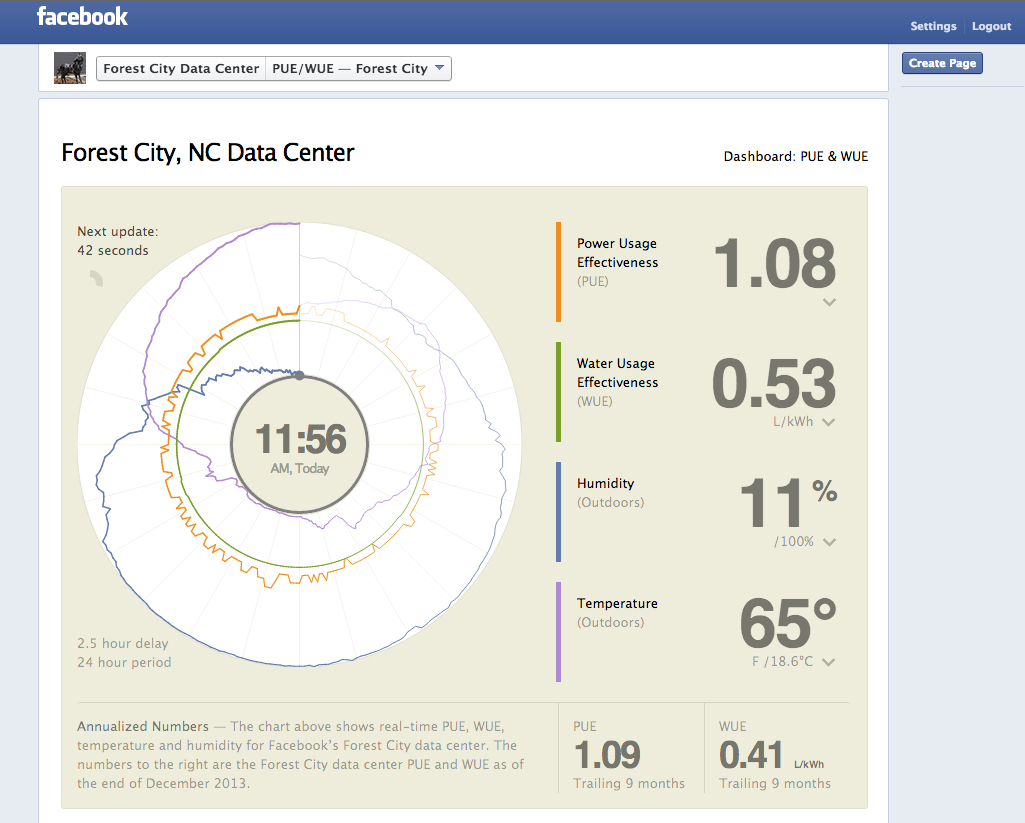
Facebook is at the forefront of this pro-transparency movement. Last April, the company debuted real-time public dashboards that track and share energy and water efficiency in its datacenters. Now the social media giant is open sourcing the code to enable others to retool it for their own reporting needs.
"In the spirit of transparency, we encourage others to share these data as well," writes Lyrica McTiernan, program manager for sustainability at Facebook. "To make this easier, today we're open sourcing the code for these dashboards so anyone can use it."
The dashboards report continuous, real-time data for two key efficiency metrics: Power Usage Effectiveness (PUE) and Water Usage Effectiveness (WUE). They were developed for Facebook's Prineville, Oregon and Forest City, North Carolina datacenters, and will also be used in future sites. The Luleå, Sweden datacenter (the first one) will soon be reporting data, followed by the Altoona, Iowa facility, currently under construction.
When Facebook started sharing the reporting info, the company explained that the decision was a natural extension of its Open Compute Project (OCP), which makes public all of Facebook's server, storage, and datacenter designs to foster energy efficiency and an ecosystem of designers and suppliers of this gear.
PUE has become the default standard for measuring the overall "green" health of a datacenter. It is a simple metric that takes the total power entering the datacenter and divides it by the power used by the IT equipment. (Lower scores are more desirable with 1.0 being the ideal score.)
PUE was developed by Hewlett-Packard and donated to the industry organization, The Green Grid, to improve energy efficiency in the ICT industry, but it was never intended to be used in cross-company comparisons. In general, when device efficiency is low, reducing PUE can have a nice effect on carbon footprint. However, when IT device efficiency is at the upper limits, PUE is less influential.
Another problem with the metric is that a company could obtain a perfect score but still get all of its energy from a dirty or non-renewable energy source, like coal. A further issue is that as facilities change and improve their energy efficiency, the rating could actually go even higher – leaving a company that bases its success on PUE with little incentive to make green changes.
According to Tom Raftery, principal analyst at GreenMonk, "That's the fatal flaw of PUE. It's designed to measure the efficiency of a facility, not the IT equipment."
Web giants, like Facebook and eBay, look at additional criteria for a deeper understanding of their datacenter performance. For instance, instead of just using PUE, they also incorporate overall carbon output as well as the total amount of water used for cooling.
Using the WUE metric, which was created by The Green Grid, in tandem with PUE is a good start for cloud datacenter operators or telcos that don't have the resources of a hyperscale Web giant. WUE is a simple ratio like PUE, but in this case, a facility's total water consumption is divided by the amount of water used to cool the IT equipment.
Facebook launched the PUE and WUE dashboards about a year ago and open sourced the front-end code around the same time. Now, as McTiernan explains, the code for both the front-end user interface and a back-end data aggregator is published on GitHub. The two components can be used together or separately.
Cloud provider Rackspace Hosting took part in beta testing the code and is considering adopting it for its datacenters, according to Facebook.
When Facebook first open sourced the front end code, the company invited the community "to poke through the code and make updates to it."
"Do you have an idea to make these visuals even more compelling?" queried Facebook. "Great! We encourage you to treat this as a starting point and use these dashboards to make everyone's ability to share this data even more interesting and robust."


